
User Guide
Nonprofit Revenue Planning Tool
You: A nonprofit focused on doing Real Good.
Us: A nonprofit focused on helping you do more of that.
The questions you’ve probably asked yourself: Is our hard work going to pay off? We doubled our revenue last year, can we do it again? Should we hire more staff?
Welcome to our data-driven revenue prediction and comparison tool designed for nonprofits with an annual revenue of at least $50,000. This tool leverages historical financial data to provide insightful predictions about your organization's future revenue, helping you plan effectively and make informed decisions. This tool is intended for educational purposes only and should not be taken as a guarantee. Statistician George Box famously said “all models are wrong but some are useful.”
We hope this tool is useful for you. Keep scrolling to learn more!
Table of Contents
Where does the data come from?
What is the intended use of the tool?
Ready to use the app? Click below!
What information do I need?
This tool is intended for nonprofits required to file IRS Forms 990, 990EZ, or 990PF. To use this tool, you'll need:
Your organization's Employer Identification Number (EIN)
Your organization's NTEE Broad Category. Find your NTEE category here.
Revenue history for the past 2-5 years (at least one year must have nonzero revenue)
For the purposes of the tool, revenue is the sum of all sources of revenue found on lines 8 through 11 in Part I of Form 990
On the Form 990EZ, this corresponds to the number reported in Part 1 on line 9
On the Form 990, this corresponds to the number reported in Part 1 on line 12
Worried about data privacy? We do not save any of the data you input into the tool! The data we use in our analysis is publicly released by the IRS each year.
Revenue Planning Tool
⋆
Revenue Planning Tool ⋆
Ready to get started? Use the app below or click here to open the app in a separate window!
If you want to learn more or read step-by-step instructions, just keep scrolling.
Note that we currently do not have support for a mobile version of this app so we recommend using it on a desktop or laptop computer for best results!
Where does the data come from?
All revenues from nonprofits are publicly available to promote transparency and public trust that nonprofits are using their donations responsibly. Our predictions are powered by open source data from the National Center for Charity Statistics CORE Series Dataset, which contains comprehensive information from IRS Business Master Files and IRS Form 990 filings. The dataset covers the period from 1989 to 2022 and includes millions of records from hundreds of thousands of nonprofit organizations. We specifically used the PZ scope for 501c3 charities, which contains over 8 million records from approximately 500,000 nonprofit organizations.
Note: This dataset does not include organizations filing Form 990-N (postcard filers), typically small nonprofits with annual revenue under $50,000. Small nonprofits should therefore use caution when interpreting predictions.
How does the tool work?
Step 1: Finding Similar Organizations
To predict your future revenue, we first identify similar organizations based on two key factors:
NTEE Category: Organizations within the same nonprofit industry group.
Revenue History: Organizations whose past revenue trajectories closely match your recent financial history.
For example, if you provide revenue data for 2022, 2023, and 2024 and seek predictions for 2025 and 2026, the tool searches our historical dataset (1989-2021) for organizations with similar three-year revenue trends. Suppose an organization had an identical revenue trajectory from 2015 to 2017; we then use their revenue outcomes from 2018 and 2019 as insights for your potential future revenue.
Because many factors influence revenue beyond historical trends, we select the five most closely matching organizations. Together, these matches help us provide a balanced and more reliable prediction.
These similar organizations are helpful for prediction, but we also tell you about them because there is someone who has been where you are now! We hope you can learn from them and their experience to help you reach your goals.
Technical note: The similarity between your organization and others is calculated using a nearest neighbors algorithm with Euclidean distance—a straightforward method that measures how "close" your revenue patterns are compared to others, based purely on historical financial data.
Step 2: Predicting Future Revenue
Using data from these five similar organizations, we train a sophisticated predictive model called a Gaussian Process. This flexible model can effectively capture complex patterns in the financial data of organizations similar to yours and provides built-in methods for assessing how confident we can be about the predictions (us nerds call it uncertainty quantification).
Each prediction from our model comes with an estimated range. Specifically, we provide lower and upper bounds representing a 95% confidence interval, meaning we are 95% confident (haha, get it?) about the estimated range! Our predictions are intentionally conservative, providing wide ranges to ensure your organization's true revenue trajectory is reliably captured.
Intended Use
We designed this tool to assist nonprofits in strategic financial planning by offering realistic revenue forecasts grounded in robust historical data. We hope these predictions help you anticipate financial trends, set achievable goals, and navigate future financial landscapes confidently.
Disclaimers and Cautions
Dataset Accuracy: The NCCS Core dataset may contain errors. When reviewing similar organizations, always verify financial data independently. If further investigating the identified similar organizations, consider reviewing their Form 990 filings directly through resources such as the IRS Tax Exempt Organization Search. Contacting organizations directly may sometimes be necessary for clarification.
Reporting Errors: If you identify inaccuracies in our dataset, please notify us via email by reaching out to contact@realgoodai.org.
Outliers: If your revenue history includes significant outliers (unusually high or low revenue years), predictions may be less accurate. Consider excluding these outliers or interpreting predictions cautiously. You can even play around with the tool by trying it out with and without the outlier year to see how the predictions change for educational purposes!
Revenue History of Zero: The tool requires at least one year of nonzero revenue. Inputting zero-only revenue will result in unreliable predictions and may break the code. However, if you only have zero revenue, you can experiment with hypothetical revenue scenarios for educational purposes.
Confidence Intervals: The provided confidence intervals are conservative: they are likely a little bit wider than they need to be, just to be extra cautious!
Private Foundations: Although NCCS does also provide data for private foundations, this has not been incorporated into our tool (yet). Private foundations should therefore use caution when interpreting predictions.
Do’s and Don’ts
DO pair this with your other planning tools to get a fuller picture... It’s great for sparking ideas and conversations, but should not be used in isolation!
DO research the matched organizations to see what other factors may be relevant to their trends.
DO think of the predictions as ballpark estimates, not precise forecasts. Pair this with your other planning tools to get a fuller picture.
DON’T make financial decisions based on this tool alone.
DON’T forget that the data has limits. Not everything is captured in the numbers!
DON’T rely only on this tool. Instead, use it alongside your usual planning process.
Step-by-Step Instructions
Before Launching the App
Gather the following information:
Employer Identification Number (EIN) formatted as XX-XXXXXXX.
NTEE Broad Category (or your best guess—see the note below)
Revenue history for 2-5 years:
Revenue can be found as the sum of all sources of revenue on lines 8 through 11 in Part I of IRS Form 990.
On the Form 990EZ, this corresponds to the number reported in Part 1 on line 9
On the Form 990, this corresponds to the number reported in Part 1 on line 12
| NTEE Broad Category | National Taxonomy Of Exempt Entities - Core Codes (NTEE-CC) | Three letter abbreviation |
|---|---|---|
| Arts, Culture, and Humanities | A | ART |
| Education (minus universities) | B (but not universities) | EDU |
| Environment and Animals | C, D | ENV |
| Health (minus hospitals) | E, F, G, H (but not hospitals) | HEL |
| Human Services | I, J, K, L, M, N, O, P | HMS |
| International, Foreign Affairs | Q | IFA |
| Public, Societal Benefit | R, S, T, U, V, W | PSB |
| Religion Related | X | REL |
| Mutual/Membership Benefit | Y | MMB |
| Universities | B40, B41, B42, B43, and B50 | UNI |
| Hospitals | E20, E21, E22, and E24 | HOS |
If unsure, refer here and match your organization type. This will give you the NTEE-CC code (letter from A-Y) and you can use the table above to match to the Broad Category. You can also refer to the NCCS Frequently Asked Questions about NTEE codes if you need more information.
Using the App
Step 1: Input Information
Launch the app and enter your EIN, NTEE category, and revenue data.
Click Submit.
Verify the information displayed. If we already have some data (especially for years prior to 2021), we'll display it for comparison. Check carefully for discrepancies.
If discrepancies arise, double-check your numbers. No need to worry if our numbers differ by a few dollars. If you notice potential errors in our dataset, please let us know to help us and NCCS maintain accurate records. You can shoot us an email at contact@realgoodai.org.
Note: We do not save any of the data or information you input into the tool.
Step 2: Reviewing Predictions
After confirming your data, click Submit again. It may take a few minutes to generate results.
Once ready, the app will display:
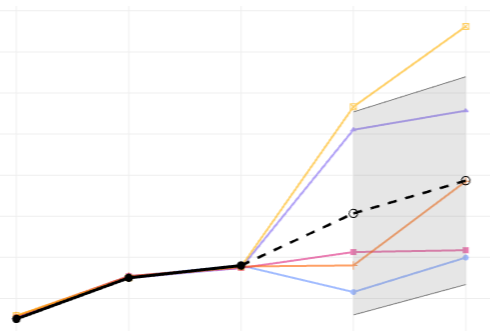
Interactive Plot:
Shows your historical revenue and future revenue predictions, including 95% confidence intervals.
Includes revenue trajectories of the five most similar organizations for comparison.
Note, you can play around with aspects of the plot and even download it as a static image!
Table of Similar Organizations:
Lists their EIN, current organization name, years matched to your revenue history, subsequent years used for prediction, and their similarity ranking (1 being the closest).
Predicted Revenue Table:
Provides your predicted revenues and corresponding confidence intervals, reinforcing the data presented visually in the plot.
Step 3: Interpreting the Results
You may notice a lot of variation across matched organizations! Some have downward trends, others have upward trends, while still others have a mix of both over the years. This is because there are so many factors that contribute to revenue trends behind the scenes. While the NCCS Core Dataset contains a rich set of variables from IRS 990 forms, it cannot account for everything that goes on “behind-the-scenes” in a nonprofit’s activities. Since our tool does not account for all these variables that can affect revenue, it is not meant to be used as an “end all be all” prediction of your organization’s future! We use statistics to give rough estimates of what we might statistically expect given organizations who have had similar revenue trends in the past, but we deliberately show you these organizations so you can see for yourself the different patterns that arise! This tool is meant to be used in conjunction with other tools your organization already uses to plan for the future, not to replace them. We do not advise that any financial decisions be made solely based on the output from our app, but consider our app as one more option to add to your toolbox for planning purposes! Use this information to strategically assess your financial planning and to explore further insights by examining similar organizations.
If you have any questions or want to give us feedback, please reach out by emailing contact@realgoodai.org.