
Real Good Research
Our research is all open source, and we are excited to share our results (and failures) with you.
Our Focus Areas
-

Neural network-free AI
Some form of neural networks underlie most AI, and they are the “black box.” Further they need an unreasonable amount of data and resources. We think there is another way and are convinced using Gaussian process models or other statistical models will solve many of the issues with current AI including data and computational efficiency, explainability, and uncertainty quantification.
-

Doing Good with Good AI
There are a lot of data science tools (other than neural networks!) that can really help the world. We work with nonprofits and other researchers to perform analyses that solve problems vital to humanity. These are often overlooked because they would not make a company money, but we are happy to use our expertise for the public good.
Selected Projects to eliminate Neural Networks in AI
Can we determine how an AI generated image can be attributed to the training data?
Cody Schultz and Dr. Eric Bell
Artists have been concerned that AIs are infringing on their copyright by blatantly copying their work. However, this is very difficult to prove since neural networks have no explanation for their predictions. We are developing methodology that could help this by breaking apart the architecture and using Gaussian Processes on each layer to attribute the percent reliance on each piece of training data. This could not only help artists protect themselves from theft, but could allow for a system where artists could be properly paid. Further, this could have further implications in simplification of AI models, where the most vital pieces of data are identified.

How can we help identify when AIs are lying?
Dr. Eric Bell and Dr. Amanda Muyskens
Because of the “black box” of machine learning algorithms, mistakes that AI’s make are more believable to humans reading them. This is leading to misinformation and limits the utility of AI to the public. We believe that an AI’s response should be reflective of the confidence of the model in the question it is asked. However, this requires new mathematical methodology, which is exactly what our team is doing. In our proof of concept transformer models, we have eliminated neural networks entirely, and in doing so, we have engineered the model to be able to provide statistics-based uncertainty for each generated token. Additionally, we are pursuing a formal sensitivity analysis to decide how errors in the model can be attributed throughout the architecture of the neural network to try to identify if there is a simpler form of uncertainty that can be defined.
Selected Projects Doing Good
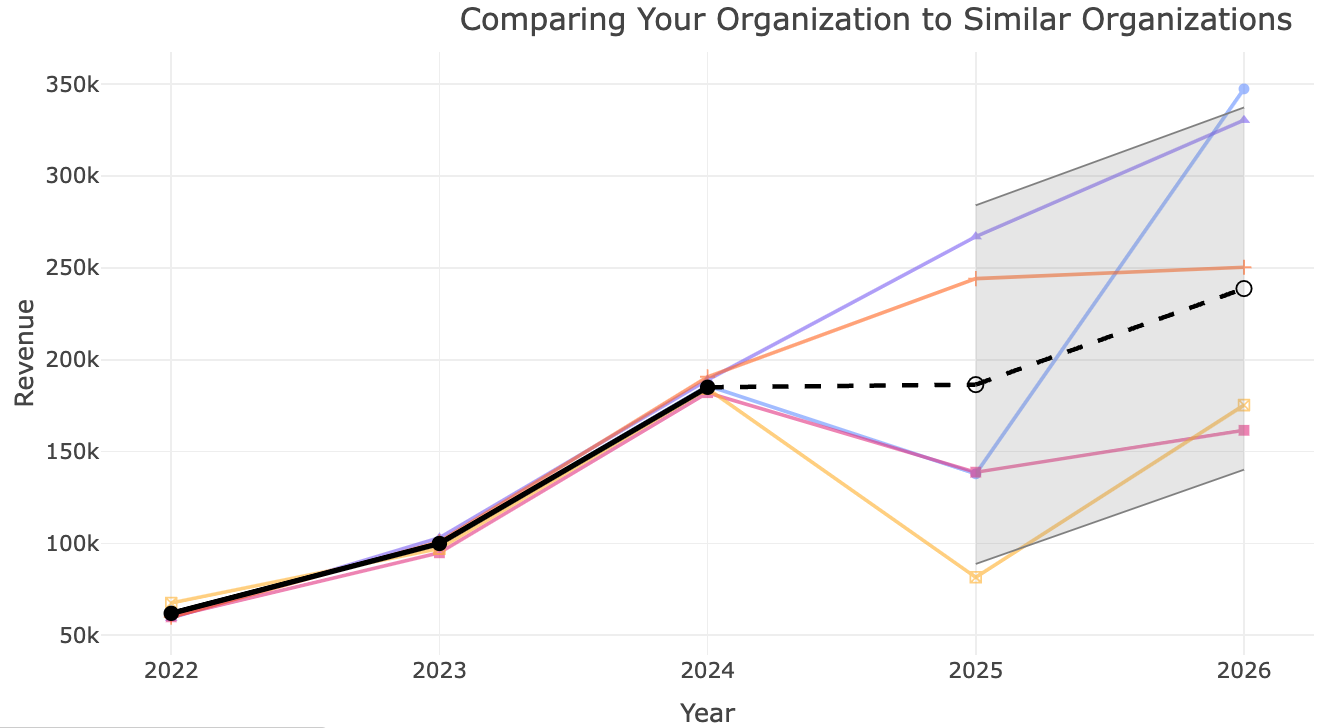
How can we help nonprofits plan for their future and learn from each other?
Mayleen Cortez-Rodriguez
An important part of our mission is to help the world with real good data science. We developed a revenue prediction tool for nonprofits. The goal is to provide a free and simple-to-use tool that helps nonprofits plan for the future, set realistic goals, and learn from others who have been in their shoes. Using open data from the National Center for Charity Statistics, which offers a database with financial information on over a million nonprofits since 1989, we find other organizations from the same sub-sector that had similar revenue trends in the past and use Gaussian Processes to predict an organization’s future.
Can we measure the impact of policy on the unhoused population among older adults?
Dr. Imène Goumiri
This research presents a comprehensive, data-driven assessment of Continuum of Care (CoC) effectiveness in supporting unhoused older adults (65+) across California. The analysis leverages publicly available data, rigorous statistical modeling, and an innovative interpretation methodology to identify factors impacting the unhoused population and to inform policy and resource allocation. By integrating diverse datasets including unhoused counts, population demographics, and geographical information, and employing both Random Forest and ANCOVA models, we aim to uncover the underlying drivers contributing to housing insecurity in this vulnerable demographic. A key innovation is the "prediction set" approach, which enables a counterfactual comparison of CoC performance by standardizing confounding variables. Our findings highlight the critical role of housing affordability and economic stability, provide a ranking of CoCs based on their effectiveness under controlled conditions, and offer concrete policy recommendations for targeted interventions and best practice dissemination. This study contributes to a more transparent and evidence-based approach to addressing California's escalating unhoused crisis.

Some Past Presentations and Manuscripts
* Coming Soon *