It’s fire season in California, which means it’s hot and dry and any damaged power-line or carelessly lit campfire can quickly become a raging fire that puts thousands of people (and their homes) at risk. In 2025, more than 8000 wildfires in California burned through about 500,000 acres of land, killing 31 people and destroying 16,627 structures¹. That year, the Eaton Fire in Altadena, CA was particularly devastating, destroying 9,413 structures and killing 19 people over the span of 24 days². This sets the scene for a conversation that our very own Dr. Mandy Muyskens had with one of our nonprofit partners last year. This particular California nonprofit organization works with other local nonprofits, and they noticed something following the Eaton Fire. Donations and support seemed to increase for local nonprofits in the immediate aftermath of the fire (yay for humanity)... but this initial influx was followed by a period where support dried up (well, dang). They noticed that nonprofits seemed to need long-term support to recover after a disaster, but support immediately following the Eaton Fire dried up too quickly (no pun intended). One theory is that people initially give more of their time and money based on greater perceived need, but once the disaster is no longer in the headlines, they assume there is no more need (or perhaps the sad reality is that a new disaster soon takes its place, and thus people naturally shift their support elsewhere). As our nonprofit partner described her post-disaster fundraising frustrations, a question began bubbling in Dr. Mandy’s mind about how we could help. Could we use our statistical knowledge to prove that nonprofits really do need long-term support after disasters, not just an initial bump in donations immediately post-disaster?
And thus, a star I mean a research project was born.
Like any good researcher, I started by looking at the existing scientific literature to see if anyone had already studied this question or some version of it. It turns out that not many have. I found precisely (checks notes) one paper that specifically focused on the relationship between natural disasters and nonprofits³. This paper basically found small but positive correlations between disaster damage and county-level nonprofit outcomes, such as total revenue, total assets, and total number of nonprofits, meaning that they found non-profits saw an increase in financial support as a result of a disaster, even up to two years later. There technically is a second paper that had an analysis of how disaster damage affects the total number of social capital organizations (which includes some nonprofits) at the county-level, but the main focus of that paper was actually analyzing the relationship between disasters and poverty, not nonprofits⁴. While the first paper sort of seemed to answer our research question, I wasn’t totally satisfied given our information from someone experiencing it firsthand. First, the paper was a decade old and we now have much more data to work with than they had at the time. Second, their statistical approach quantified correlations, but really what most people want to know about are causal relationships.
Correlation or Causation?
I’m a (recently minted) expert in causality, that is, cause-and-effect, so I get really intrigued by questions related to causality. You might have heard the saying “correlation does not imply causation.” In case you need a refresher, check out our YouTube short: Ice Cream and Sunburns. The idea is that sometimes when you analyze data it might look like one thing is causing another, but it really isn’t. Sometimes there really is a causal relationship, but the trick is how to “prove it,” that is, show strong enough evidence that what you’re seeing is indeed causation, not simply correlation. That’s what the field of causal inference aims to get at and it's the field I got my PhD in. Unfortunately uncovering and quantifying causal relationships is pretty dang hard in general.
The reason why is best explained with an example. Suppose I told you that I have proof that bandaids make kids cry. Why? Because I see more kids with bandaids in tears than kids who don’t have a bandaid. Hopefully you’re raising your eyebrows at me. I seem to be ignoring an important factor, like, I dunno, the fact that you only put a bandaid on a kid if they have an injury? In other words, it is completely unfair for me to say that bandaids cause tears, because comparing kids with bandaids against kids with no bandaids is not actually a fair comparison to begin with. Okay, maybe in this case it was easy to see that the causal claim made no sense. But in many cases, there are so many factors that it can be hard to tell what’s actually going on.
In general, when you want to analyze the causal effect of X on Y, you take a group that experienced X against a group that didn’t experience X and compare their outcomes… but unless you can randomly assign people to each group, most of the time the two groups are already very different to begin with and it’s just not fair to compare them. Thus, in most cases, like ours, you have a bunch of data that was just observed out in the wild and you must conduct an analysis that controls for all these differences. To get a little nerdy, the trick is controlling for all confounding variables, i.e. making sure that no one can point a finger at you and say “HA but you can’t say X caused Y, clearly it was this other thing you didn’t account for. Take that loser.” Anyway, to have any hope, you need a rich dataset… which luckily we do have!
The Data
The National Center for Charity Statistics (NCCS) publishes open-source financial data for U.S. nonprofit organizations pulled from Internal Revenue Service (IRS) reports⁵. I’ve actually used this data before to create our Nonprofit Revenue Planning Tool. Using this data, we were able to get county-level totals of revenue, assets, expenses, and total number of nonprofits from the years 1991 to 2021. Arizona State University maintains the Spatial Hazard Events and Losses Database (SHELDUS), which contains decades of information about natural disasters for U.S. counties⁶. Using this data, we were able to get county-level totals of natural hazard and disaster damage totals for every U.S. county from the years 1991 to 2021. We also used some U.S. Census and American Community Survey data to get other socioeconomic variables important to the analysis.
The Problem
The big, general research question is, “what is the causal effect of natural disasters on the nonprofit sector?” However, due to the available data and existing statistical methodology, the question had to be modified. We landed on something like “what is the effect of exposure to severe disaster damage on nonprofit revenue, assets, and expenses.” The thing is, we have to define “severe disaster damage.” On top of that, the majority of causal inference methods can only deal with binary exposure variables (think, you either take the medicine or you don’t; you either buy the product, or you don’t). Somehow we have to define when a county experiences severe disaster damage and it has to be a “either they did or they didn’t” type of thing. There are lots of options for what to do here, but we tried to ground our decision in policy relevance. It turns out that the Federal Emergency Management Agency (FEMA) has a per-capita damage threshold that they use in determining when a county has experienced such extreme damage from a single disaster that they may need federal assistance. Great! Wait, not so fast. It isn’t that easy actually, because their threshold is per disaster, but we have per-year aggregates of disaster damage in a county. We adjusted the FEMA threshold to try and account for this, but it's not perfect. The bigger issue is this all-or-nothing, binary exposure variable thing. Disaster damage is a continuous variable, meaning it can take pretty much any dollar value, but we’re thresholding it to make a binary: 0 or 1, yes or no, exposed or unexposed. Now, it's not like this hasn’t been done before. Causal inference applications are littered with researchers taking a continuous variable and making it binary. But to be honest, researchers often have very little choice. Causal inference with continuous exposure variables is a new, growing area of research, and methods are far and few in between. On top of that, we’re dealing with panel data (i.e. data from multiple units over multiple time periods) where exposure (i.e. disasters) can happen at any point. Believe it or not, pretty much every causal inference method cannot deal with the latter except for one, introduced in 2023 by Harvard researchers⁷. It was our luck that they published an R package with their paper to help people like me apply their methodology to our problem. However, the package was not set up for dealing with continuous variables. All of that is to say we had to make a choice here, and since many people have gone the binary variable path before us, it seemed reasonable enough. I suspect, though I don’t know for sure, that this could have been my downfall (duhn duhn duuuuhhhn).
The Analysis
(Was that dramatic enough for you?) Okay yes, spoiler alert, I don’t really feel like we truly succeeded in answering our original research question. It’s complicated. We sort of have a result, but I’m not convinced. The truth is science is tough. The scientific process sometimes means we are left with more questions than answers. We applied the fancy schmancy causal inference method to our dataset. I even added other fancy stuff that I won’t even get into here (but you can read our full report here if you're a super nerd). We got a null result: we found no statistical evidence that extreme disaster damage has any causal effect on nonprofit outcomes at all. This is the case even if we change the threshold for “extreme” damage or if we focus on specific nonprofit sectors (like arts organizations versus hospitals). Hey, but that technically answers my research question, right? Well, maybe. The thing is, to be a good science paper you have to be able to validate your analysis in some way. Remember how I said a key part of uncovering causality is controlling for confounding variables? The point is to ensure that your two comparison groups are not too different from each other to begin with. In the following figure, we show two plots. In both, each line represents a different confounding variable, like general county location, past nonprofit revenue, and population size (notice how there are lots of lines… 24 variables total). In a perfect experiment to test the causal effect of disasters, our goal would be to control these variables such that they were all perfect horizontal lines that are perfectly on top of the black dashed line at value 0.0. On the left, we show how the data looks when you don’t control for anything. None of the solid lines cover the dashed line and some of the lines are very far away. In general, the solid lines are spread all over. On the right plot, we show what happened after we controlled for the variables. Notice how you almost can’t see the dashed line anymore because the solid lines are more tightly concentrated around it. It’s not a perfect control, but it’s MUCH closer than the raw data. This is what you want to see when doing a causal analysis! Even though it’s not perfect, it helps us make the case that if we find a causal effect, we can truly call it causation not just correlation.
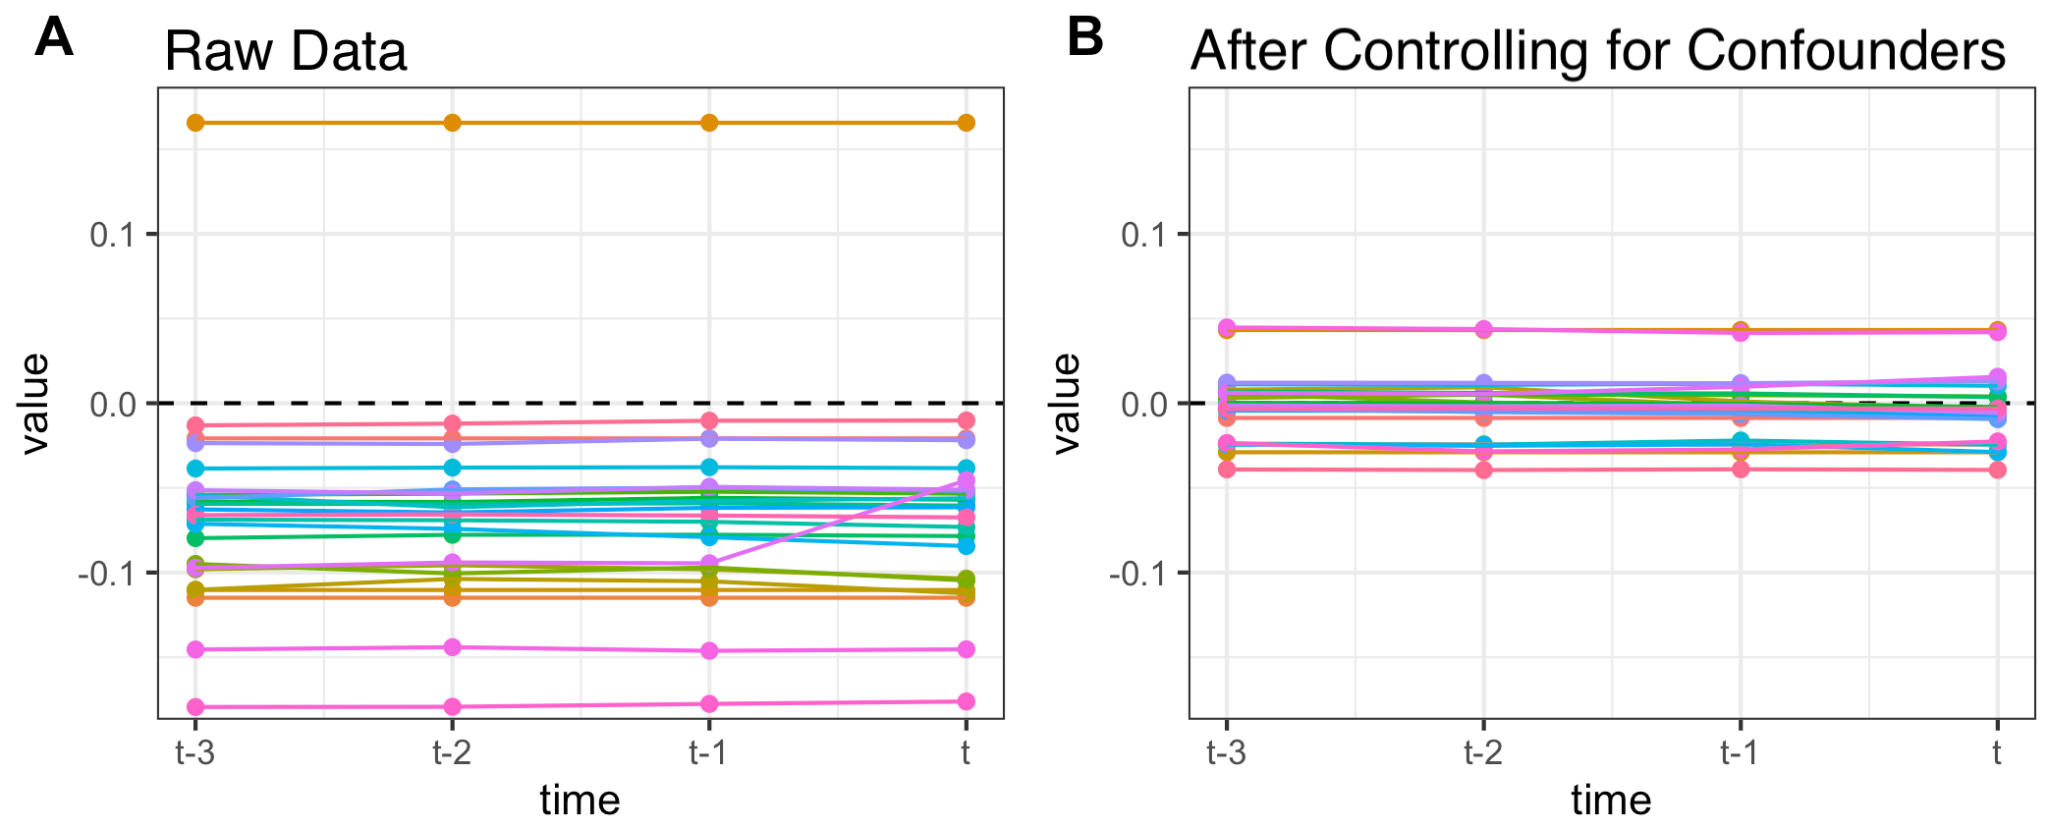
It’s also totally possible that after accounting for confounding variables, you find out that actually there is no causal relationship: i.e. a null result like we got. This could be a fine result. However, I ran the same analysis without controlling for confounders (i.e with the raw data)… and I got the same result… which is kinda weird. The issue here is that I can’t say “we got a null result because of careful science, i.e. carefully controlling for confounders” because it turns out I would have gotten the same result either way. All this means is that the jury is still kinda out in my opinion.
Surprise, Surprise… GPs show up
Okay, I was kinda stumped. And a little queasy. I spent months carefully cleaning data and applying a complicated causal analysis to account for everything I could think of, and in the end it was unclear if I actually have a null result or if I just got really unlucky with my approach. So, we decided to try a different approach that was a bit simpler, just as a sanity check. Forget the causal stuff, let’s just try to detect any sort of change before versus after extreme disaster events. So we did this cool thing with Gaussian process (GP) models (refer to Dr Mandy's Favorite Models | Gaussian Process Models for a refresher… she explains it better than I can), where we basically tried to show that nonprofit revenue is affected somehow after significant disaster damage. To be clear, we were not trying to prove that the disasters were the cause of the change, simply trying to detect if any sort of change was there.
Since we have multiple years of total revenue data for each county, we can model this data with a GP. There are different options for how to model the data. For this analysis, we consider two possible scenarios for each county:
The disaster⁸ doesn’t matter and thus one single model fits the whole data well.
The disaster does matter, so having separate models for before versus after the disaster does a better job at fitting the data.
In the first scenario, there is no meaningful difference after the disaster, so you only need one model for the whole data. In the second scenario, you actually need two models for the data because something changed after the disaster such that there is a meaningful difference before versus after. The way that we compare both scenarios for each nonprofit is through something called a Likelihood Ratio Test, which is a statistical method for testing between two hypotheses (or scenarios) like ours. We found evidence that scenario two made the most sense, i.e. that something did change post-disaster, in 58% of the counties. However, since it's possible that using two models does better in general, whether or not the disaster actually matters, we did a validation check on our results. We pretended there were fake disasters and broke the data in a lot of places. Then, we looked at how often we still chose the two model scenarios even during a fake disaster that literally could not have mattered. In 95% of those simulations, the two-model scenario fit the data best between 51% and 59% of the time. Unfortunately, for our analysis with the real disasters we got 58%, which is between 51% and 59%. This means we once again do not have sufficient statistical evidence that nonprofits are affected AT ALL after extreme disaster damage, regardless of the cause.
So, what now?
Now, since we tried two totally different statistical methods and basically got the same results both times, that does make me feel like we actually did arrive at the true answer. It’s just kind of a bummer because we really wanted to be able to tell the public “hey, please consider checking in with your local nonprofits long after disasters because the data says they need this” and we just can’t.
As a side note, this does make me wonder if other researchers have tried to answer our research question since the 2014 paper but they also got “null” results and just didn’t publish them anywhere. The thing is, despite the fact that most scientists will agree null results are valuable and useful, rarely do these types of results ever get published anywhere. Thus, you might have multiple scientists repeating similar analyses or experiments, but everyone keeps getting null results and since there really isn’t an avenue for sharing null results, none of us know about each other (sigh). This is why open science is so important to us at Real Good AI and why we are making our results and code freely available to the public. This could save future researchers some time since they might have ideas we never thought of and can try something totally new knowing we already tried two distinct approaches.
Now, our results are not a total bummer. Here’s the hopeful bit. Maybe, what this all means is that despite the reality that many nonprofits go through a hard time following natural disasters, they also tend to be pretty resilient. I mean, they kinda have to be resilient regardless of disasters considering the very real problems nonprofits are tackling (like child hunger, housing crises, and elder justice). But still, it’s good to know that this resilience appears to extend to disasters too. Maybe the systems we have in place to support nonprofits are working, at least for now, even if they are slow and even if the road to recovery is really tough. In the meantime, we still have work to do… like fixing climate change and fighting against unnecessary environmental impacts of AI. While humanity works on that, don’t forget to check in on your local nonprofits. Consider ways to support them long after devastating disasters. While we still have hope for a safe, better, brighter future, let’s keep working together to do Real Good.
Footnotes:
¹ https://www.fire.ca.gov/incidents/2025
² https://www.fire.ca.gov/incidents/2025/1/7/eaton-fire
³ Pena, A. A., Zahran, S., Underwood, A., & Weiler, S. (2014). Effect of natural disasters on local nonprofit activity. Growth and Change, 45(4), 590-610.
⁴ Smiley, K. T., Howell, J., & Elliott, J. R. (2018). Disasters, local organizations, and poverty in the USA, 1998 to 2015. Population and Environment, 40(2), 115-135.
⁵ https://nccs.urban.org/nccs/datasets/core/
⁶ https://cemhs.asu.edu/sheldus
⁷ Imai, K., Kim, I. S., & Wang, E. H. (2023). Matching methods for causal inference with time‐series cross‐sectional data. American Journal of Political Science, 67(3), 587-605.
⁸ I say “disaster” here but remember we are working with yearly disaster damage totals, not individual disasters, so I really mean “year where disaster damage crossed a threshold” but “disaster” is a bit easier to picture.

| 
|
1 for the blog post, 4 for the project
Did not open a genAI tool for any part of the writing process, but did use Google docs
Used Google search but never used the AI summary, just used actual results
However the whole project itself is a level 4 due to the code, which constitutes a central piece of the work